
As a teacher, you’ve seen how graphs can transform a pile of numbers into a clear picture that students can understand. When teaching graphing skills, it’s not just about memorizing steps. It’s about helping your class understand why different graphs are useful and how to choose the best one for the task at hand.
With the right strategies and tools, including interactive simulations, graphing can be less intimidating, more engaging, and more effective for every student.
Why graphing skills matter in math and science
Strong graphing skills for students set the foundation for success in math and science, preparing them for higher-level coursework and real-world applications. When you carve out time for graphing skills, students learn how to interpret data, spot patterns, and clearly illustrate their findings.
The most common types of graphs
What types of graphs will students encounter in K-12 education and beyond? Let's explore a few of the most common ones.

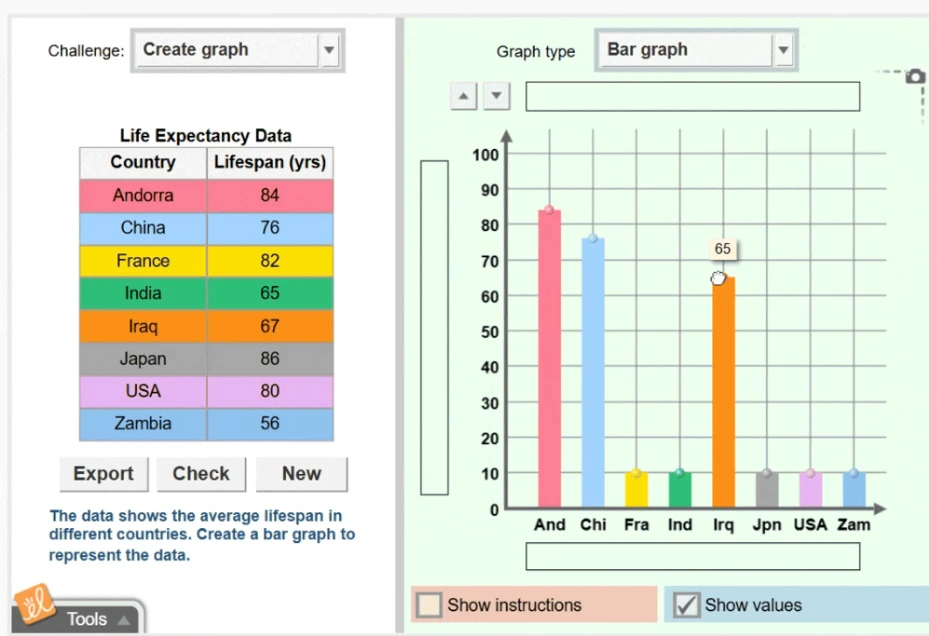
Bar graphs: Bar graphs are perfect when you want students to compare categories. Students can create a bar graph to compare test scores, survey responses, or experimental results.
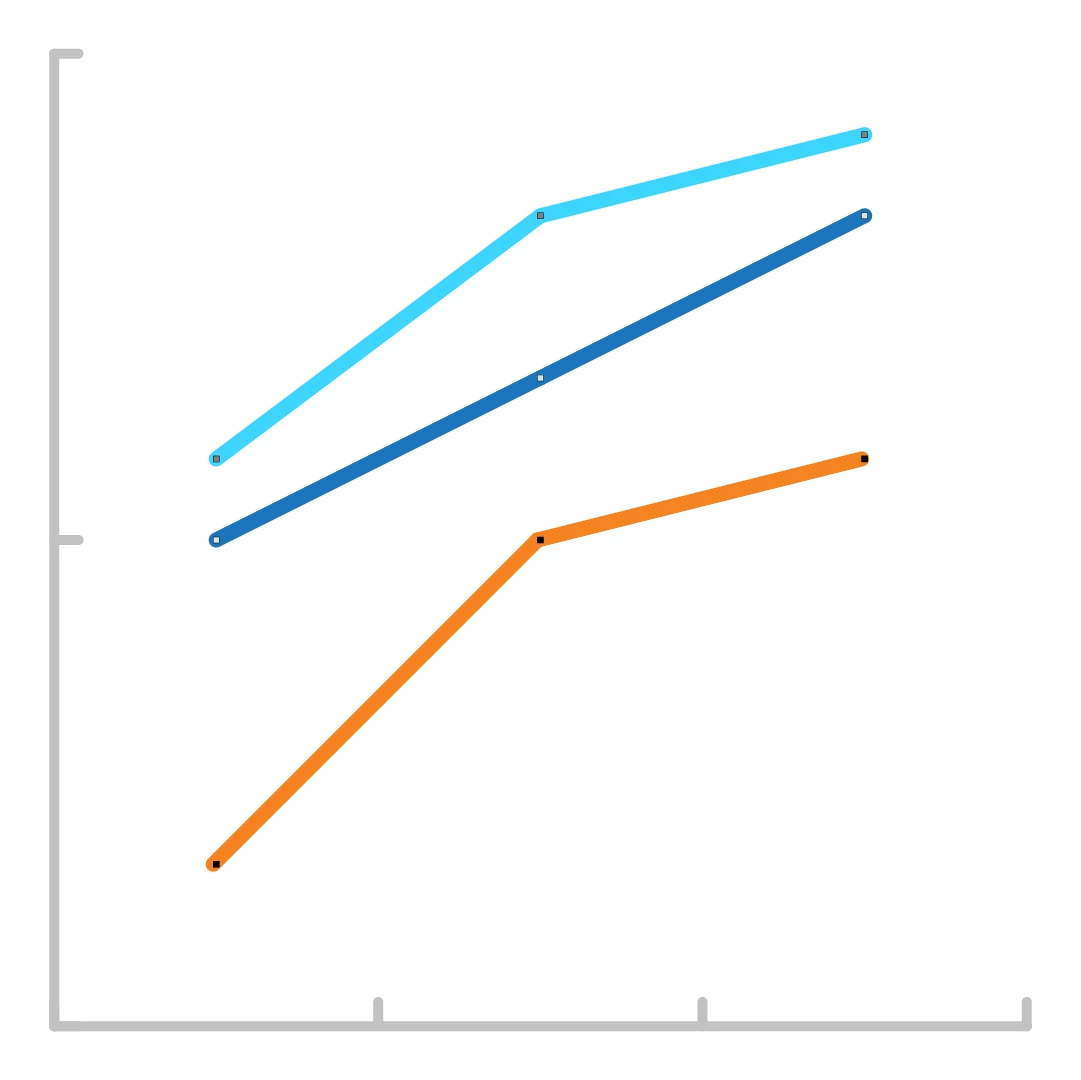
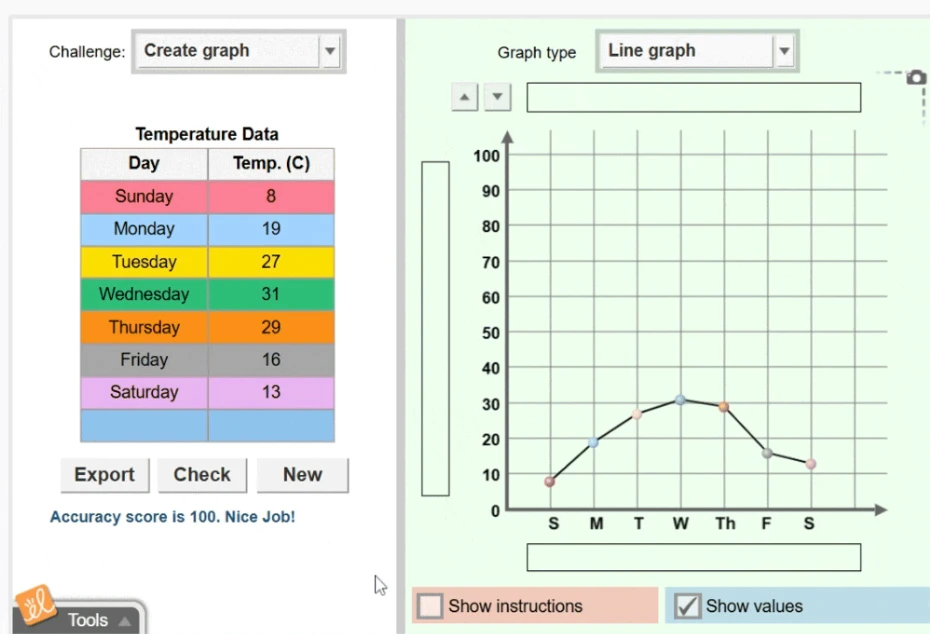
Line graphs: A line graph is ideal for showing trends, progress, or changes across a timeline. When students create a line graph, they can easily visualize upward or downward trends, helping them make predictions and understand relationships in data.

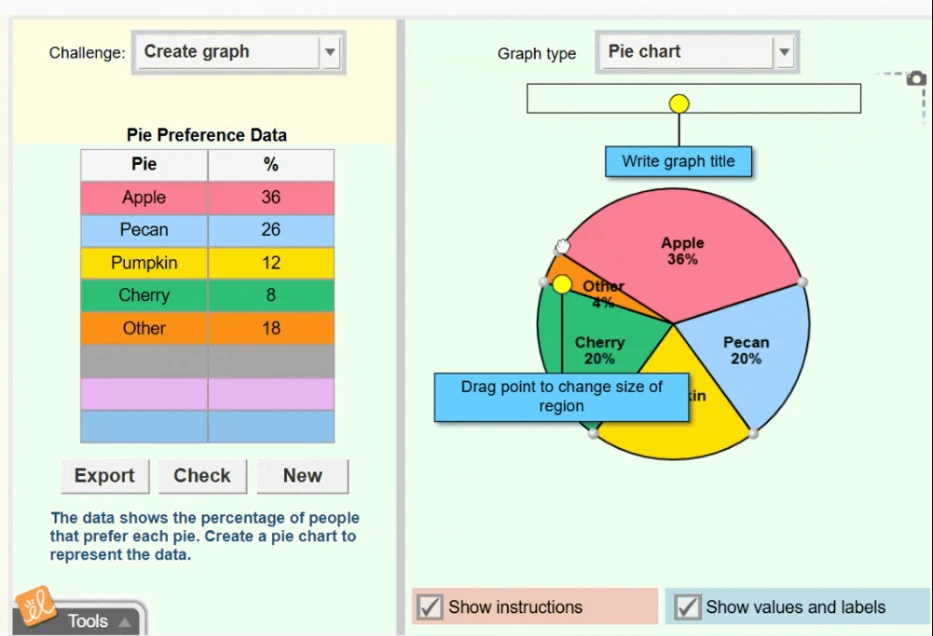
Pie graphs (or pie charts): Pie charts make percentages more concrete, whether dividing class survey results or illustrating a grocery budget. When the goal is to display proportions, have your students create a pie graph to show how parts contribute to a whole.
How to create graphs using Gizmos
Interactive Gizmos math and science simulations and STEM Cases make graphing a hands-on, engaging experience. Instead of just learning about graphs, students actively build them—improving both comprehension and retention. New Gizmos Investigations give students even more opportunities to collect unique data points and interpret their findings using Claim, Evidence, and Reasoning (CER).
“Gizmos are easy to use and useful for teaching content. I have enjoyed them and so have the students. They help the students use graphing and data to draw conclusions and provide a clearer insight into concepts taught in class.”
–Gizmos teacher
Creating a bar graph with the Graphing Skills Gizmo
With the Graphing Skills Gizmo, students can build a graph, from axis labels and scale to the graph itself. Using pre-made data sets, students can create a bar graph that accurately reflects the data and receive feedback to spot mistakes and solidify their understanding.
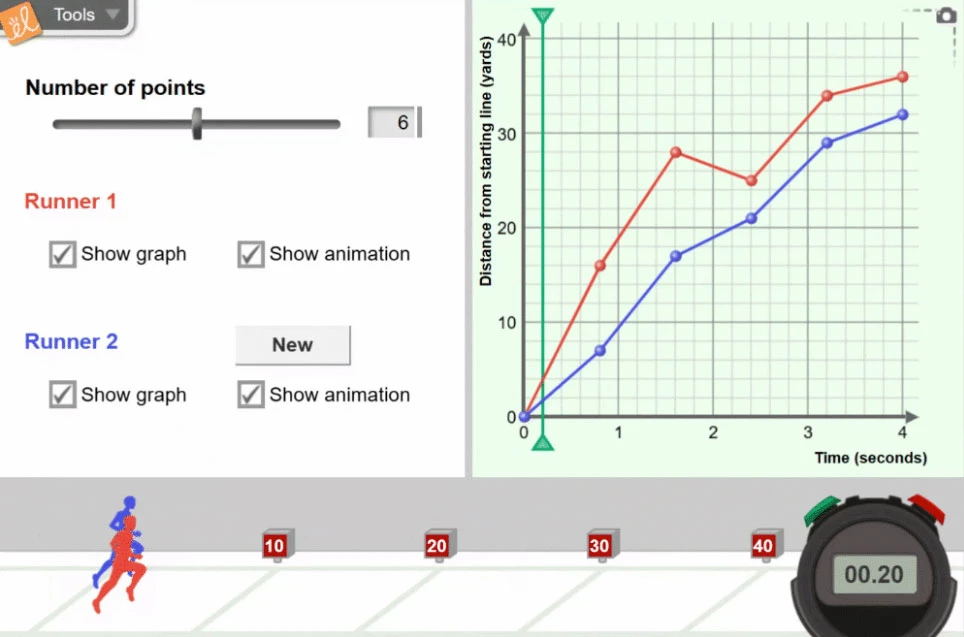
Using the Graphing Skills Gizmo to create a line graph
Students can use the same Gizmo to create a line graph that tracks changes over time. This allows them to see trends unfold and interpret relationships in experiments or real-world scenarios.
Creating a pie graph with Gizmos
The Gizmo also makes it simple for students to create a pie graph, visually showing parts of a whole. By experimenting with different datasets using pie charts, students strengthen their understanding of proportional reasoning as they recognize the relative size of each piece of the pie.
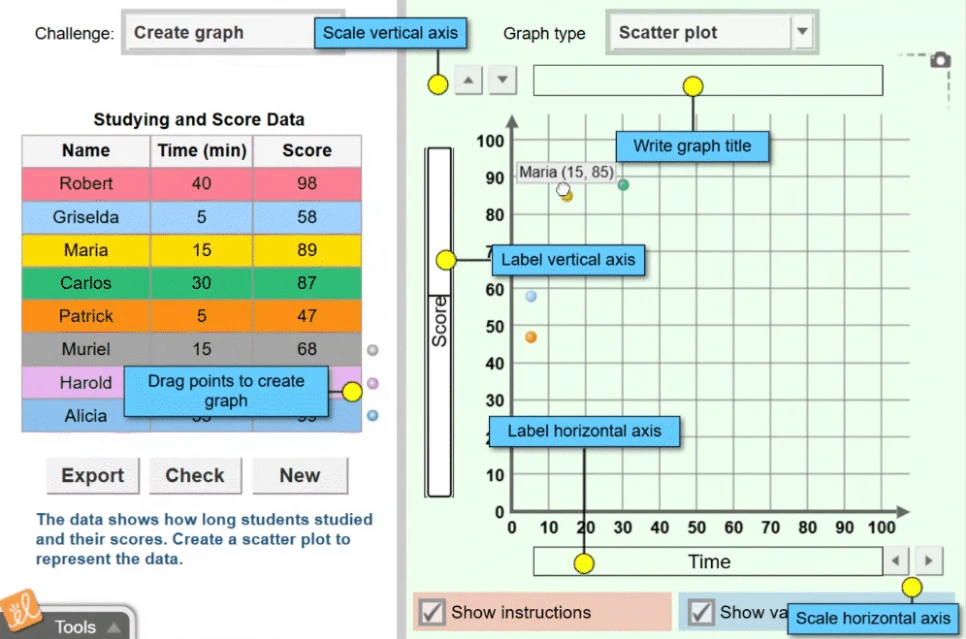
Using Gizmos to create a scatter plot
Scatter plots introduce students to correlation and data distribution. With the Gizmo simulation, students can plot points, explore relationships, and begin building the foundation for statistical thinking.
Why simulations improve graphing skills
Interactive simulations like Gizmos go beyond worksheets by boosting student engagement and deepening conceptual understanding. Students stay engaged because they’re experimenting with data in real-time instead of copying data from a textbook.
And because Gizmos are designed for inquiry-based learning, you can easily adapt activities for different levels of readiness, whether students need step-by-step guidance or are ready to tackle graphing practice independently. The Gizmos library includes a wide variety of math and science Gizmos to practice graphing skills, from elementary school to trigonometry and pre-calculus.
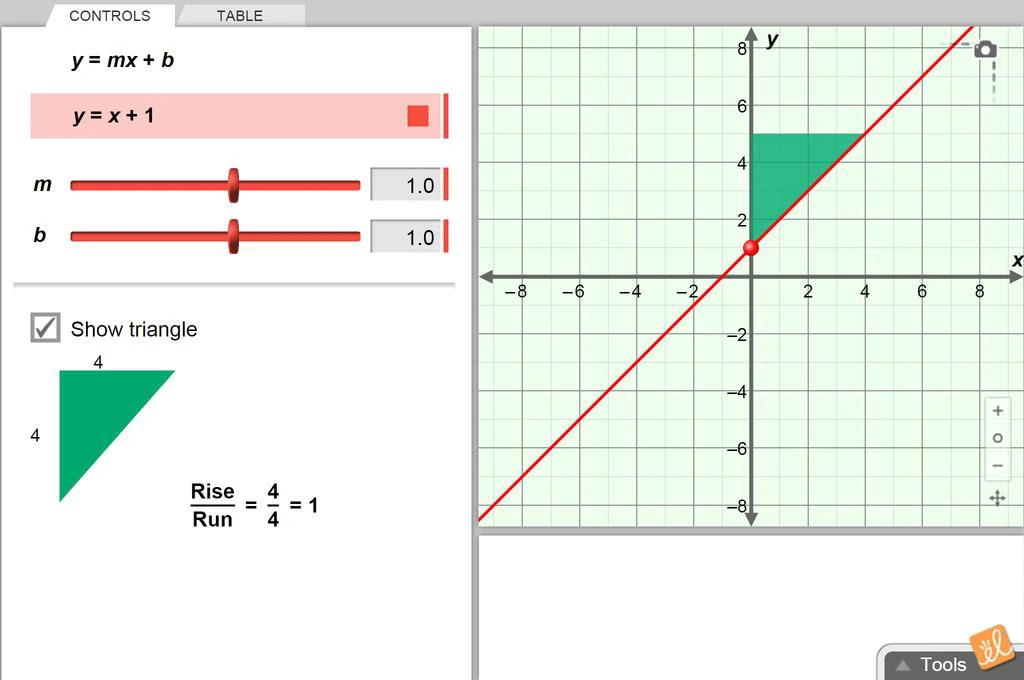
Slope-Intercept Form of a Line Gizmo
Gizmos STEM Cases, real-world cases that allow students to solve problems from the lens of a STEM professional, also bring graphing practice to life in meaningful ways. New Gizmos Investigations give students even more opportunities to collect unique data points and interpret their findings using Claim, Evidence, and Reasoning (CER).
“With Gizmos STEM Cases, I love how the students can input their data, then go and look at the graph and interpret the data. It’s a great way for them to learn through inquiry and as a hands-on lab.”
-Gizmos teacher
Try Gizmos to easily teach graphing skills today
Teaching graphing doesn’t have to be time-consuming or overwhelming. With Gizmos, you can give students hands-on practice with graphing skills, while keeping lessons interactive and manageable.
Explore how 550+ Gizmos can help foster graphing skills for students and strengthen their ability to interpret data and communicate results with confidence. Start a free trial today and watch your students’ skills (and confidence) grow, no matter how you plot the data.