Discover the math and science election connections with simulations
Mascot Election (Pictographs and Bar Graphs)
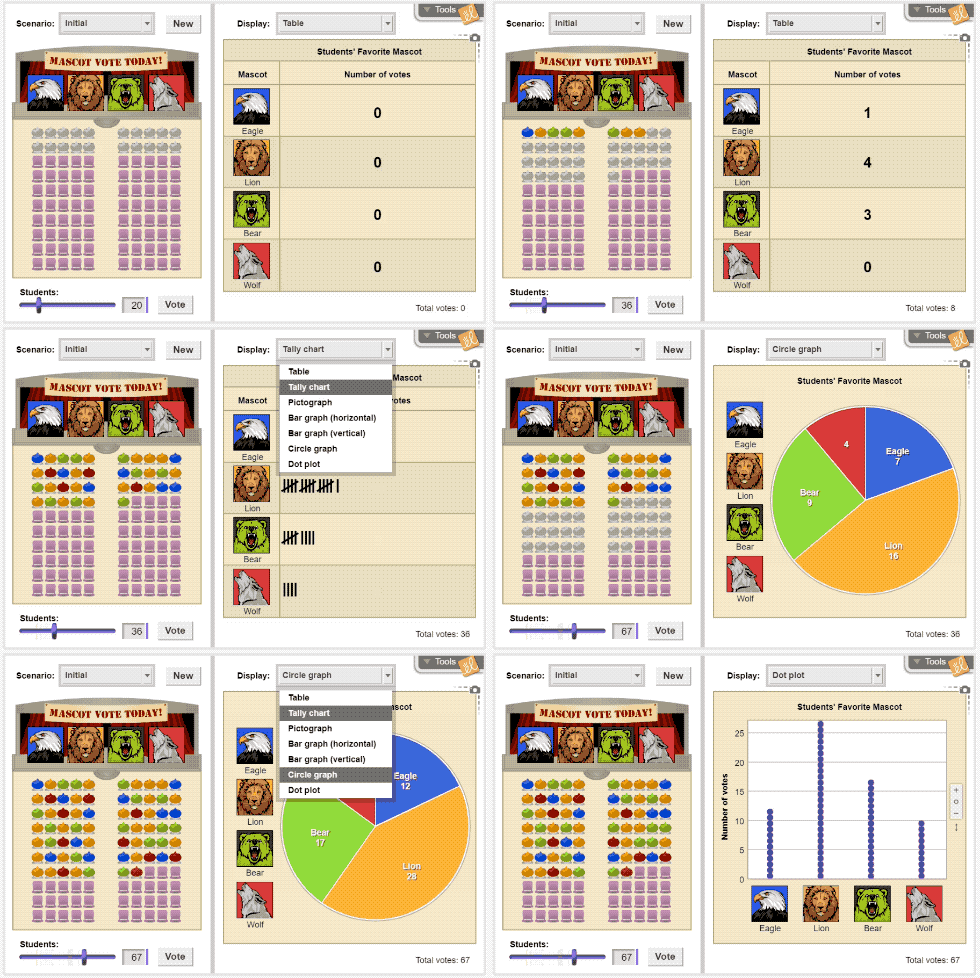
A brand new school is opening and it is time to elect the school mascot! Students can choose the Eagle, Lion, Bear, or Wolf. Voting results can be displayed in a table, tally chart, pictograph, bar graph, circle graph, or dot plot. You can change student votes by selecting a group of students and clicking a mascot.

Polling: City
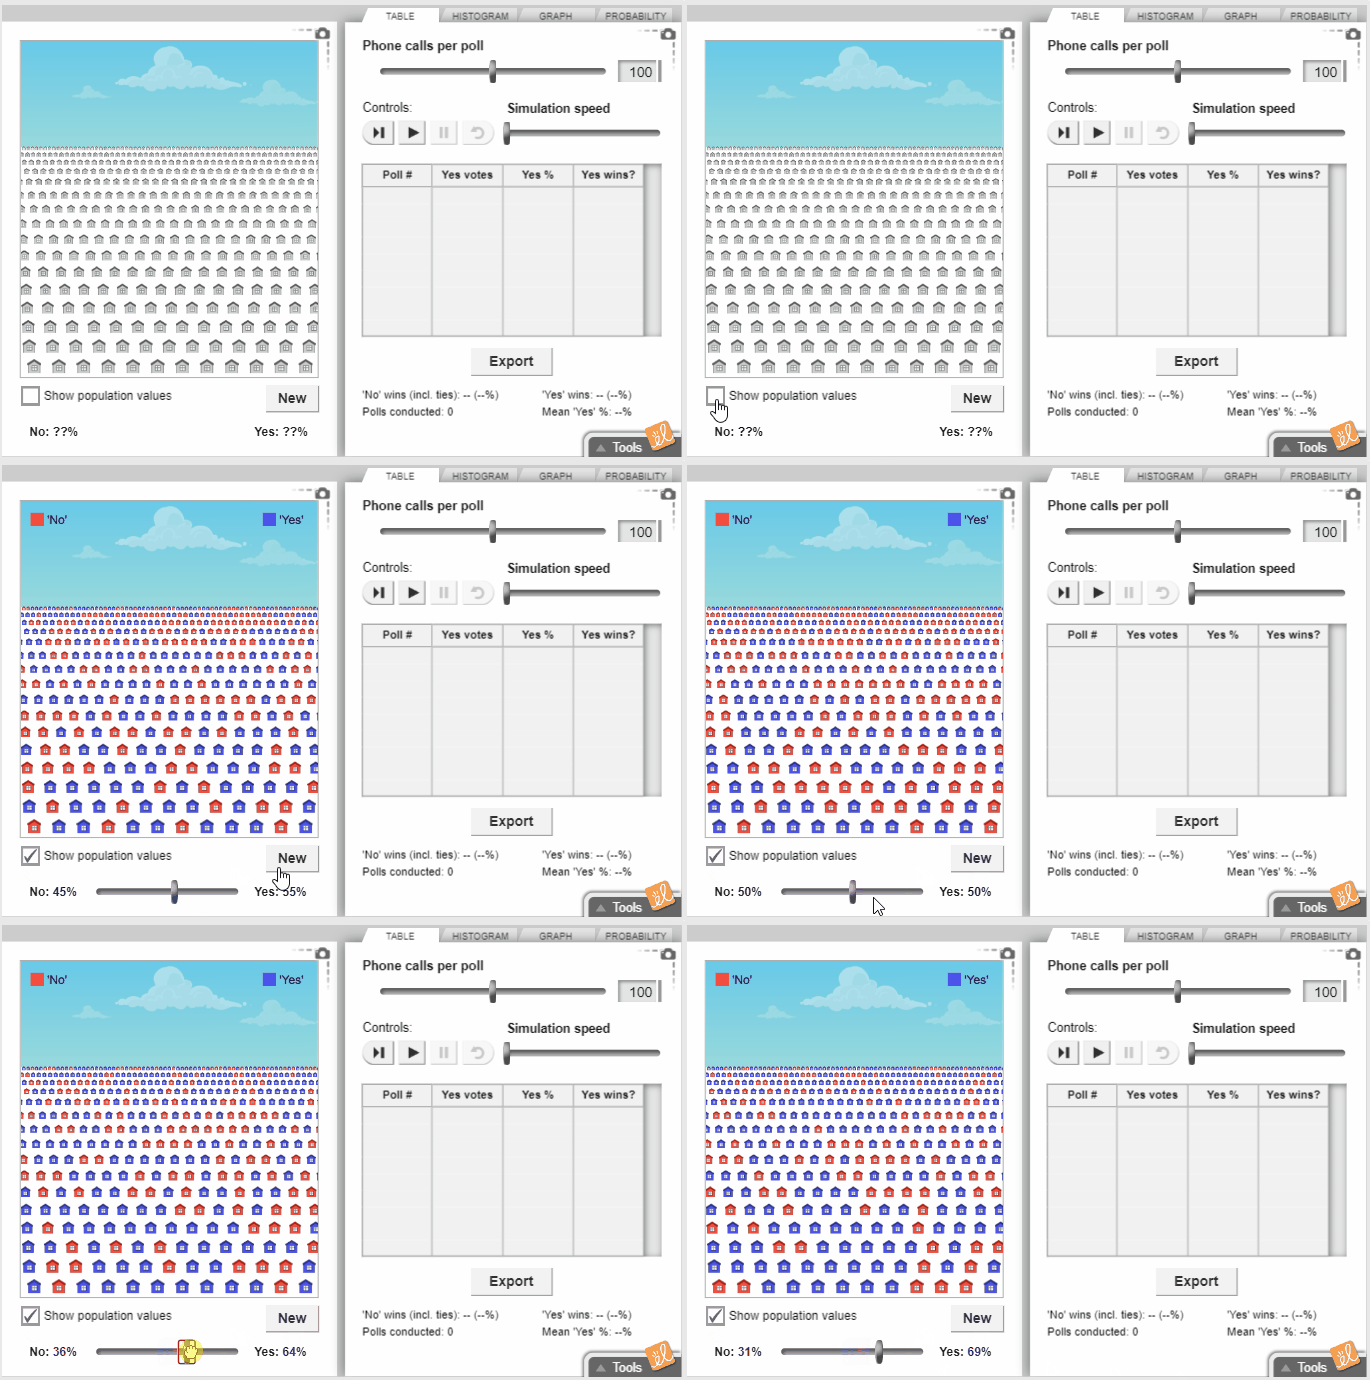
Poll residents in a large city to determine their response to a yes-or-no question. Estimate the actual percentage of yes votes in the whole city. Examine the results of many polls to help assess how reliable the results from a single poll are. See how the normal curve approximates a binomial distribution for large enough polls.

Polling: Neighborhood
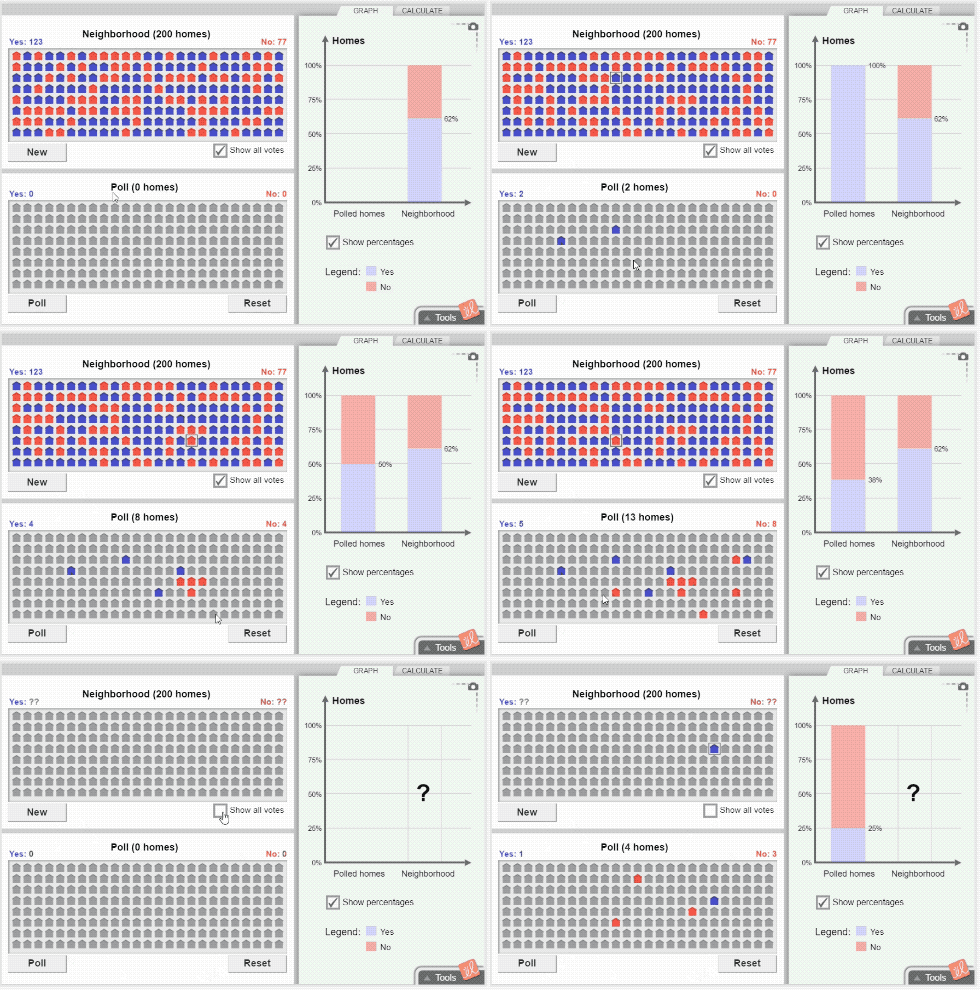
Conduct a phone poll of citizens in a small neighborhood to determine their response to a yes-or-no question. Use the results to estimate the sentiment of the entire population. Investigate how the error of this estimate becomes smaller as more people are polled. Compare random versus non-random sampling.

With the power to ask questions, see results, and draw conclusions, students learn not only the what but also the why of a topic, like elections, but there’s so much more. Browse other Gizmos collections.
