Graphing Skills
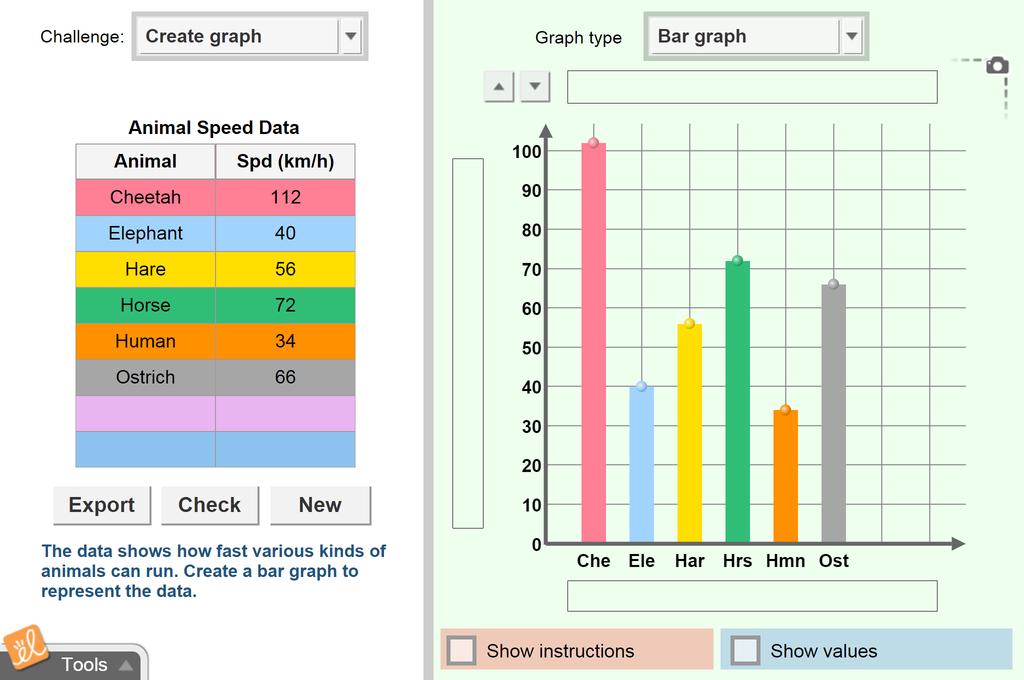
Create a graph (bar graph, line graph, pie chart, or scatter plot) based on a given data set. Title the graph, label the axes, and choose a scale. Adjust the graph to fit the data, and then check your accuracy. The Gizmo can also be used to create a data table based on a given graph.
Launch GizmoGraphing Skills
Create a graph (bar graph, line graph, pie chart, or scatter plot) based on a given data set. Title the graph, label the axes, and choose a scale. Adjust the graph to fit the data, and then check your accuracy. The Gizmo can also be used to create a data table based on a given graph.
5 Minute Preview
Use for 5 minutes a day.
LEARNING OBJECTIVES:
- Identify bar graphs, line graphs, pie charts and scatter plots.
- Explain how each type of graph is used.
- Learn to title and label graphs properly.
- Choose the optimal scale for graph axes.
- Plot bars, points, or regions accurately on a graph.
- Interpret what is shown on a graph.
- Create a data table that corresponds to a graph. (Extension)
- Recognize positive and negative relationships from scatter plots. (Extension)
VOCABULARY:
- bar graph, line graph, negative relationship, pie chart, positive relationship, scale, scatter plot, variable