Distance-Time and Velocity-Time Graphs - Metric
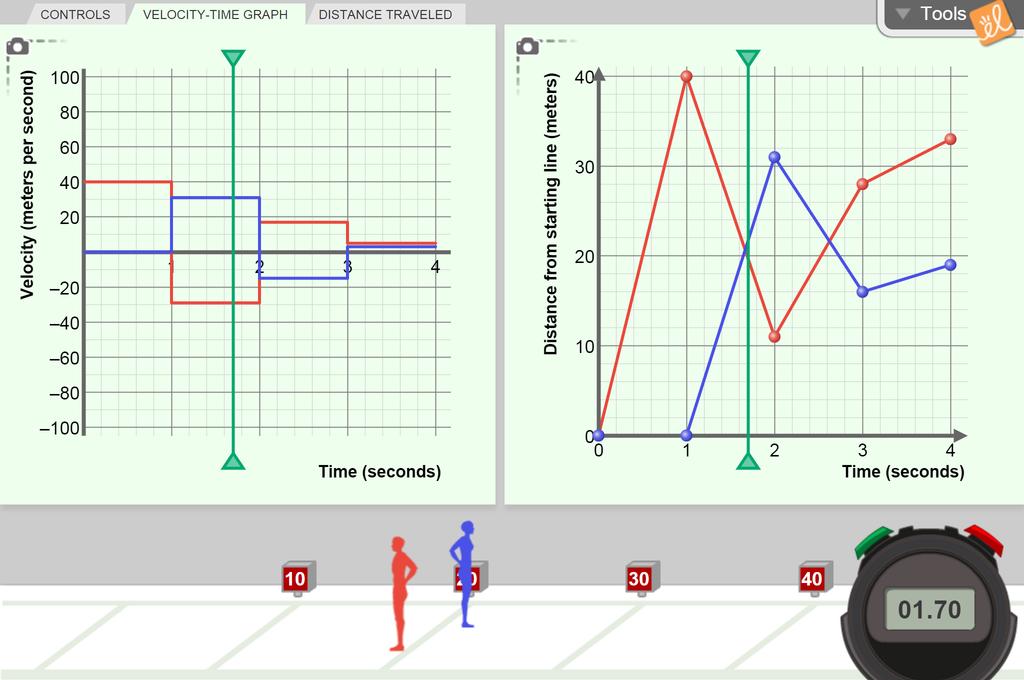
Create a graph of a runner's position versus time and watch the runner run a 40-meter dash based on the graph you made. Notice the connection between the slope of the line and the velocity of the runner. Add a second runner (a second graph) and connect real-world meaning to the intersection of two graphs. Also experiment with a graph of velocity versus time for the runners, and also distance traveled versus time.
Launch GizmoDistance-Time and Velocity-Time Graphs - Metric
Create a graph of a runner's position versus time and watch the runner run a 40-meter dash based on the graph you made. Notice the connection between the slope of the line and the velocity of the runner. Add a second runner (a second graph) and connect real-world meaning to the intersection of two graphs. Also experiment with a graph of velocity versus time for the runners, and also distance traveled versus time.
5 Minute Preview
Use for 5 minutes a day.