Real-Time Histogram
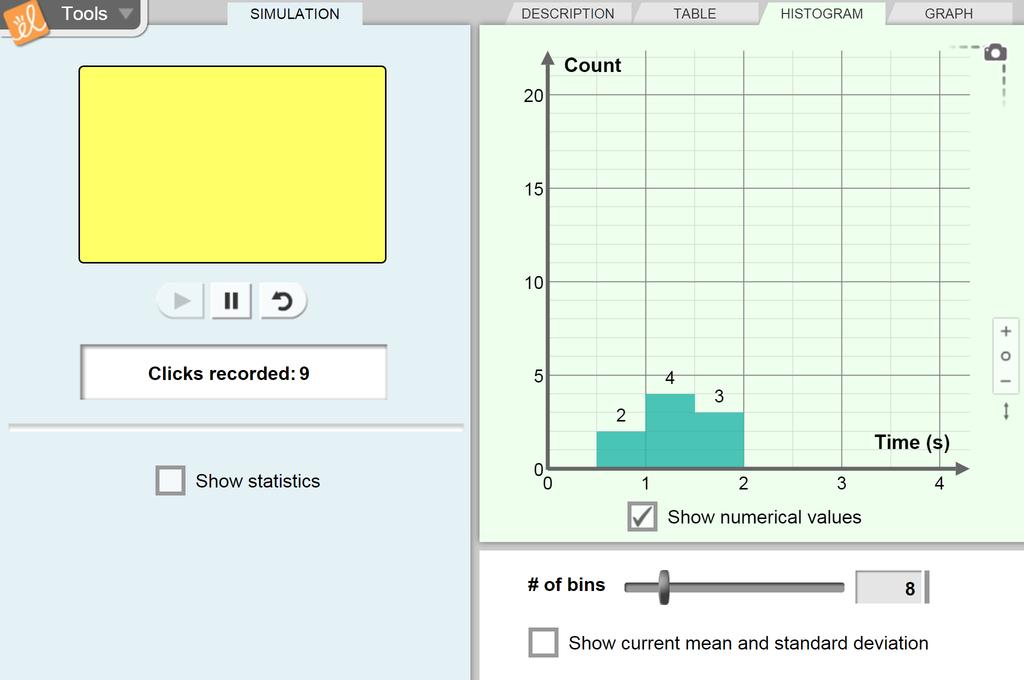
Try to click your mouse once every 2 seconds. The time interval between each click is recorded, as well as the error and percent error. Data can be displayed in a table, histogram, or scatter plot. Observe and measure the characteristics of the resulting distribution when large amounts of data are collected.
Launch GizmoReal-Time Histogram
Try to click your mouse once every 2 seconds. The time interval between each click is recorded, as well as the error and percent error. Data can be displayed in a table, histogram, or scatter plot. Observe and measure the characteristics of the resulting distribution when large amounts of data are collected.
5 Minute Preview
Use for 5 minutes a day.