Temperature and Particle Motion
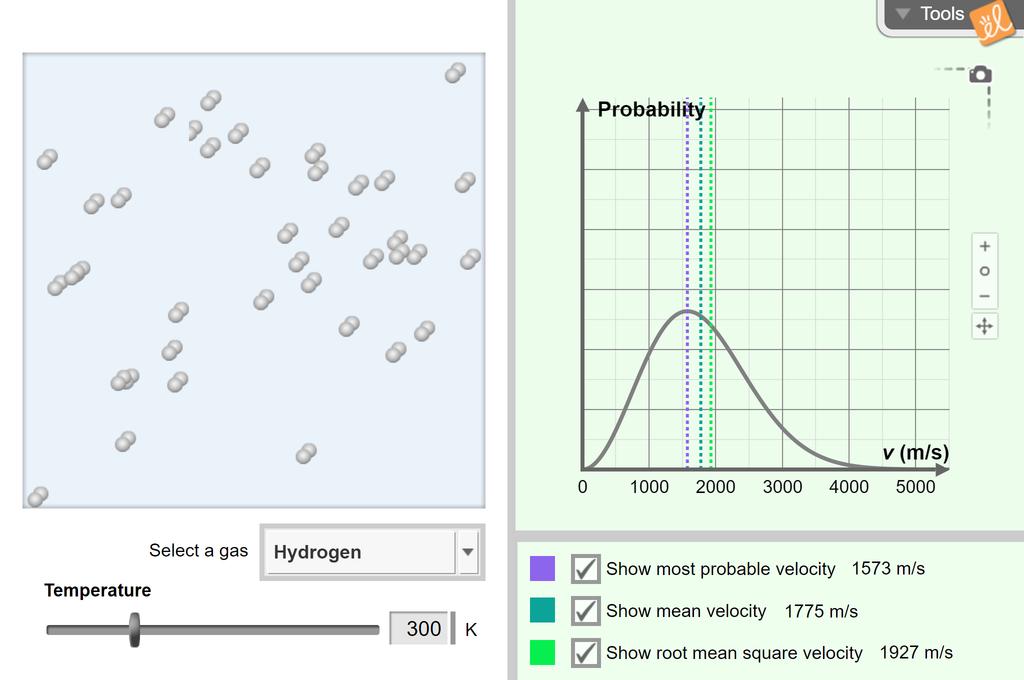
Observe the movement of particles of an ideal gas at a variety of temperatures. A histogram showing the Maxwell-Boltzmann velocity distribution is shown, and the most probable velocity, mean velocity, and root mean square velocity can be calculated. Molecules of different gases can be compared.
Video Preview Launch GizmoTemperature and Particle Motion
Observe the movement of particles of an ideal gas at a variety of temperatures. A histogram showing the Maxwell-Boltzmann velocity distribution is shown, and the most probable velocity, mean velocity, and root mean square velocity can be calculated. Molecules of different gases can be compared.
5 Minute Preview
Use for 5 minutes a day.